Monitor and Troubleshoot
Monitor VPN activity and troubleshoot issues using Vylos built-in logging, bandwidth tracking, and version information.
Choose What to Inspect
| If you need to… | Open… |
|---|---|
| Review app actions or lifecycle events | Settings → Logs → App |
| Diagnose tunnel startup or WireGuard behavior | Settings → Logs → WireGuard |
| Check live transfer and handshake information | The tunnel's status view |
| Compare recent received and sent traffic | The tunnel's bandwidth view |
| Include build information in a support request | The version details at the bottom of Settings |
Logs
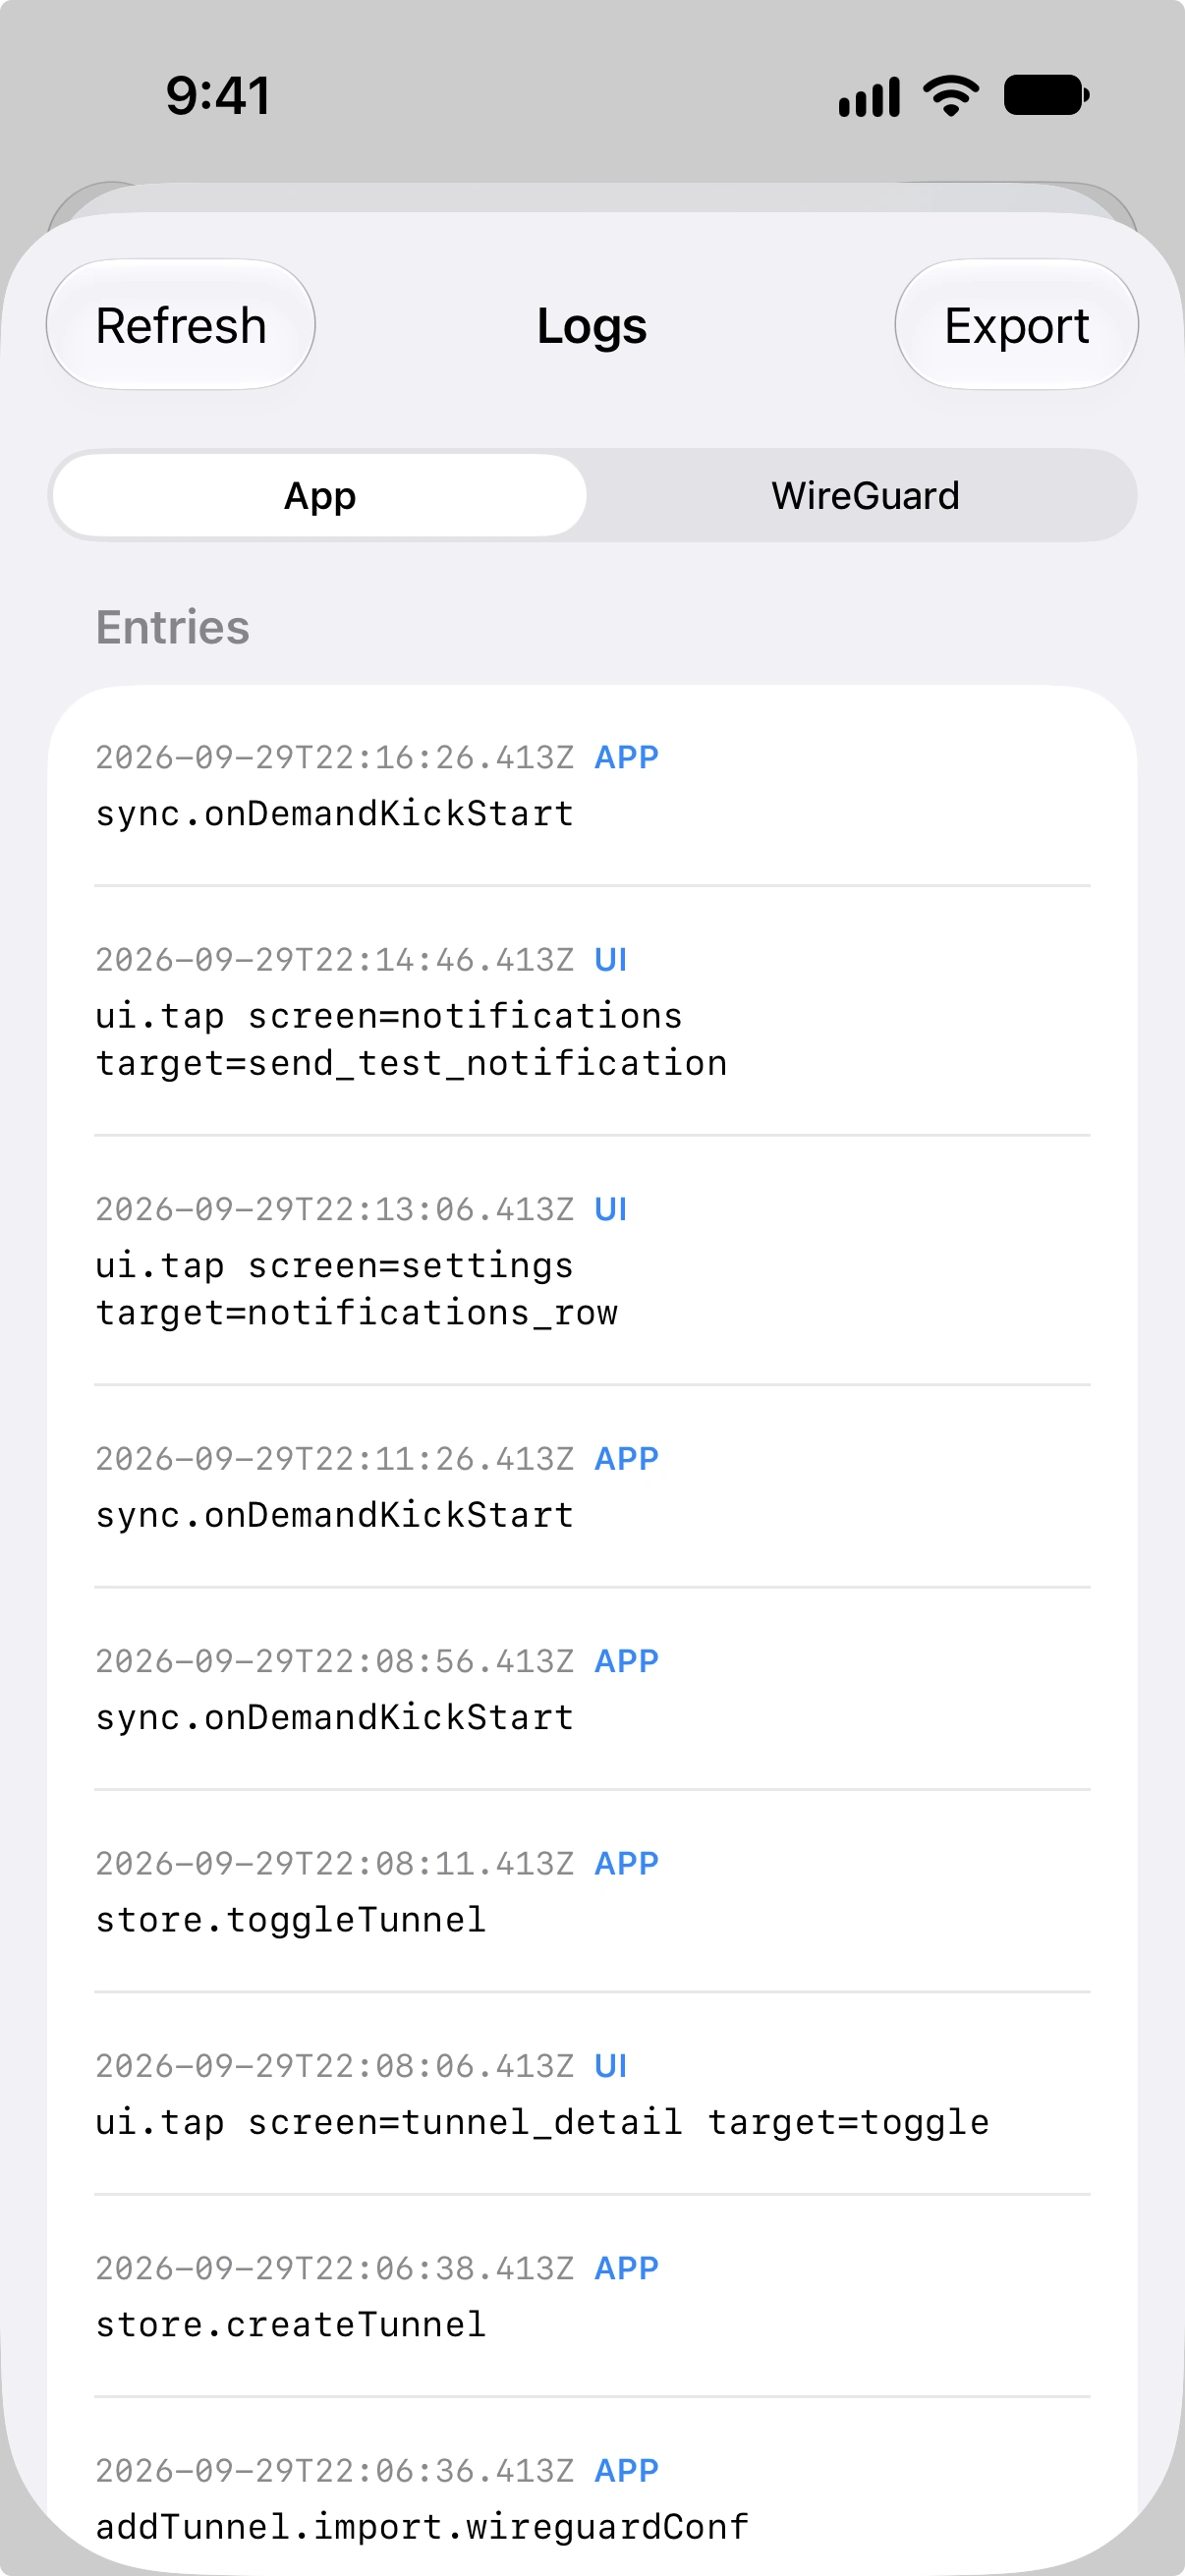
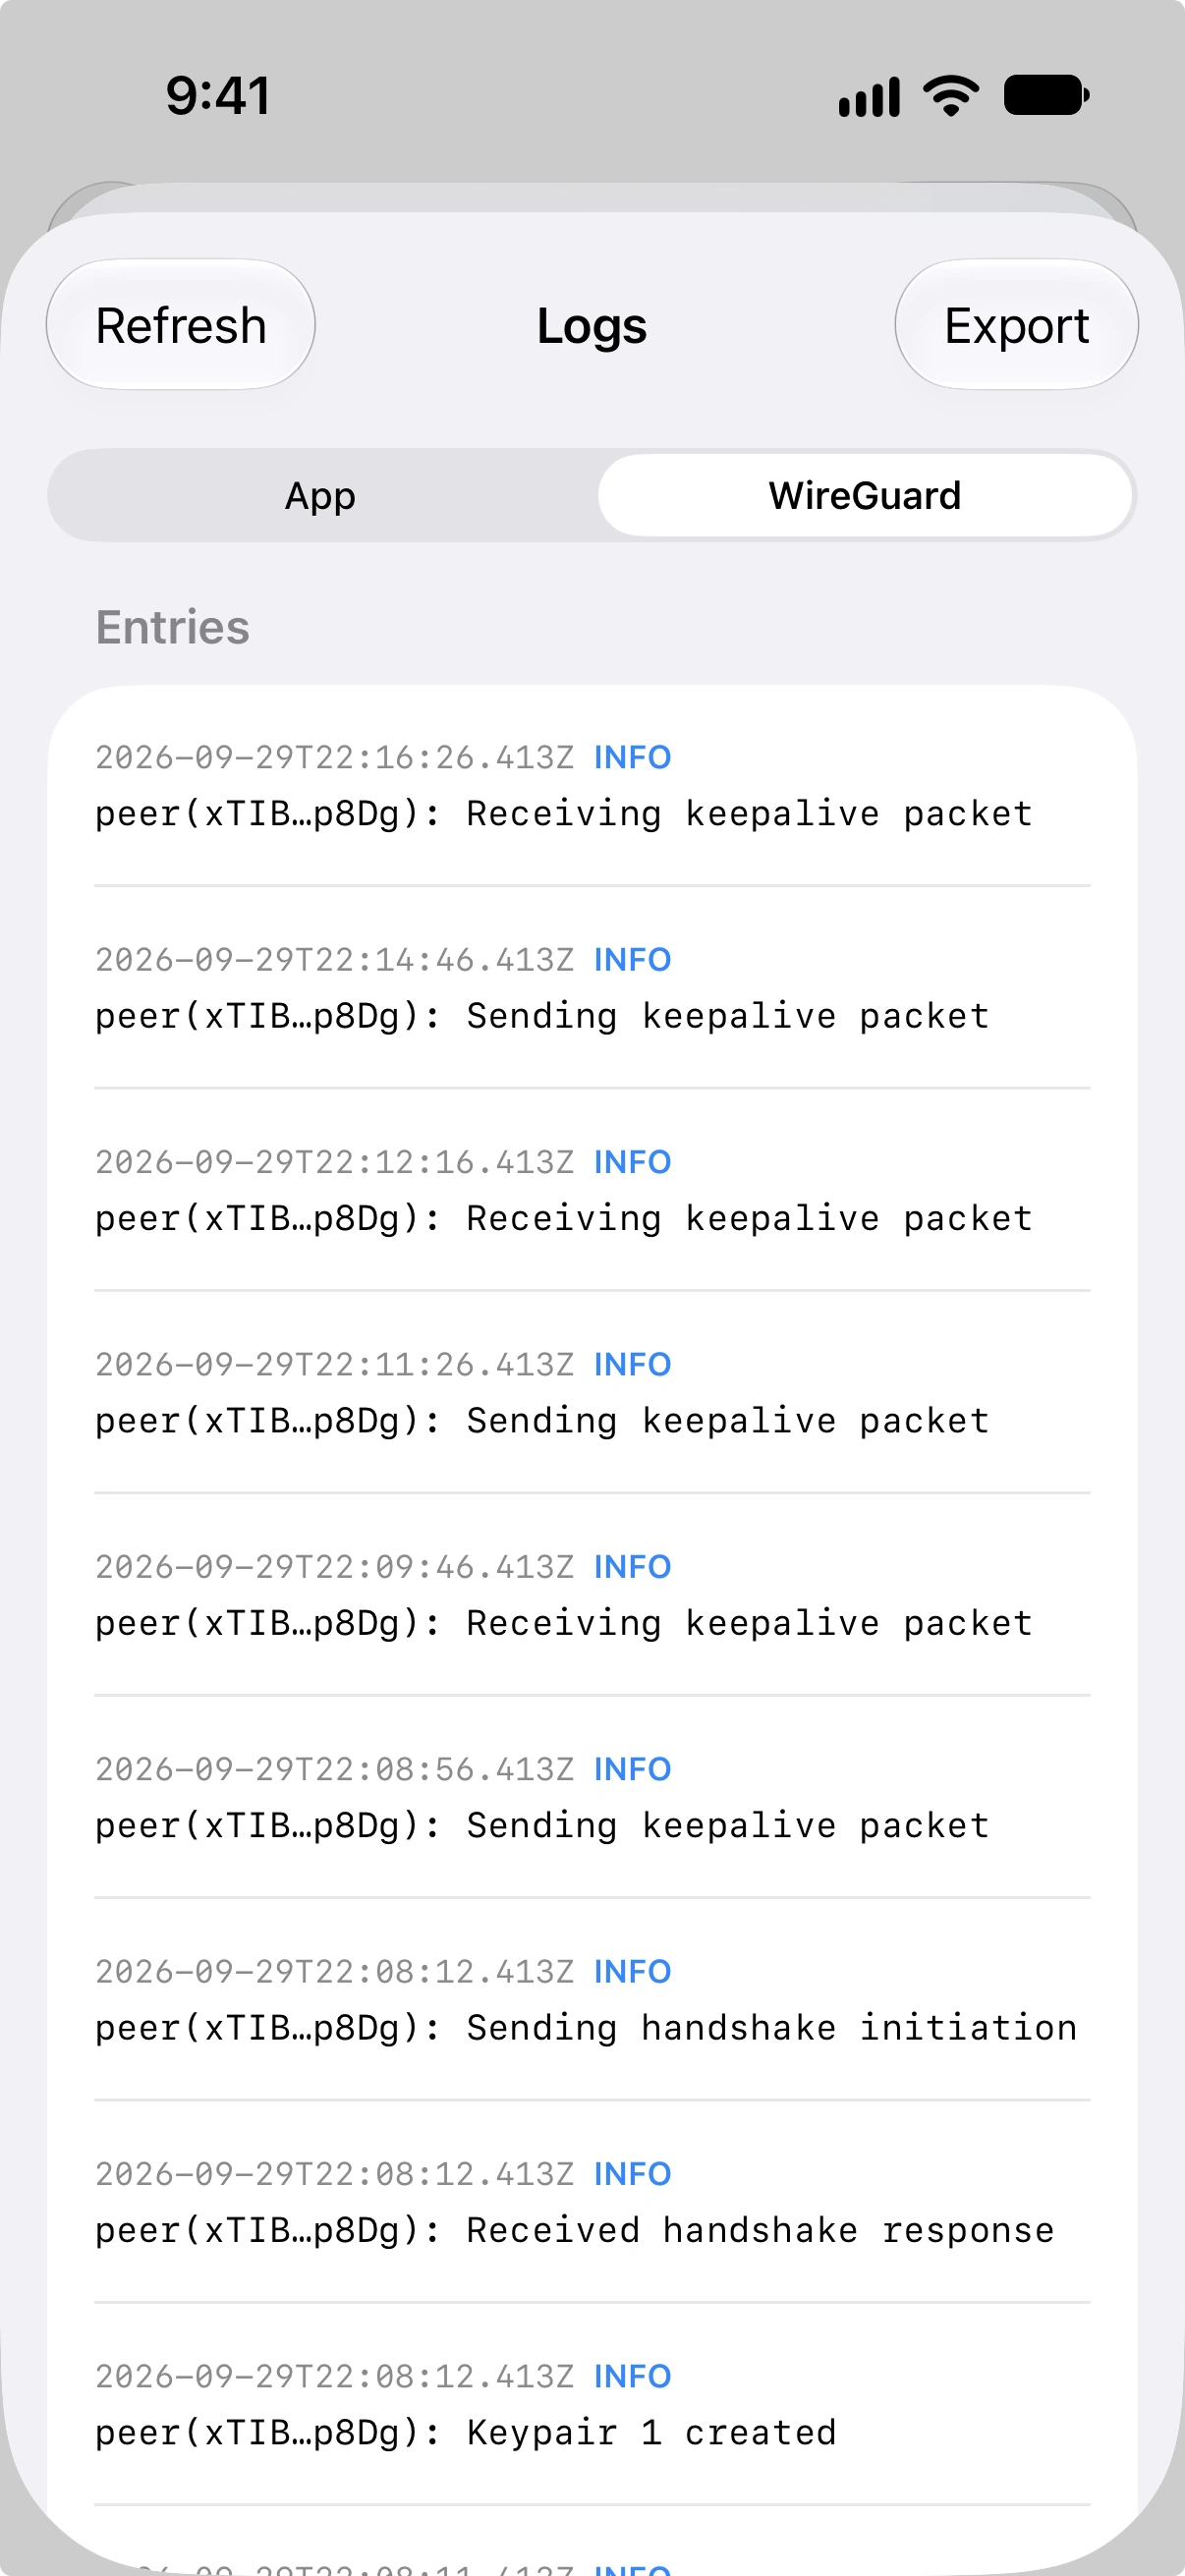
The Logs screen is accessible from Settings and contains two tabs:
- App — Application-level action logs covering UI interactions, lifecycle events, sync operations, migration events, tunnel creation, and settings changes.
- WireGuard — Network extension diagnostic logs from the WireGuard tunnel provider running in the background.
Log Files
Each tab corresponds to a pair of log files:
| Tab | Current Session File | Previous Session File |
|---|---|---|
| App | app-actions.log | app-actions-prev.log |
| WireGuard | network-extension.log | network-extension-prev.log |
When a new session starts, the current log file is rotated to the previous session file. This gives you access to logs from both the current and most recent prior session.
Log files are parsed off the main thread to avoid affecting app responsiveness.
Exporting Logs
Each tab can be exported separately. Tap the export button to generate a text file with a timestamped filename:
- App logs export as
vylos-app-TIMESTAMP.txt - WireGuard logs export as
vylos-wireguard-TIMESTAMP.txt
The export uses the system Share sheet, allowing you to save the file, send it via email, AirDrop it, or share it through any other available method.
Bandwidth Statistics
Vylos tracks receive (Rx) and transmit (Tx) data for each tunnel individually. You can view bandwidth statistics from the tunnel detail screen.
Time Ranges
Two time ranges are available:
| Range | Interval | Description |
|---|---|---|
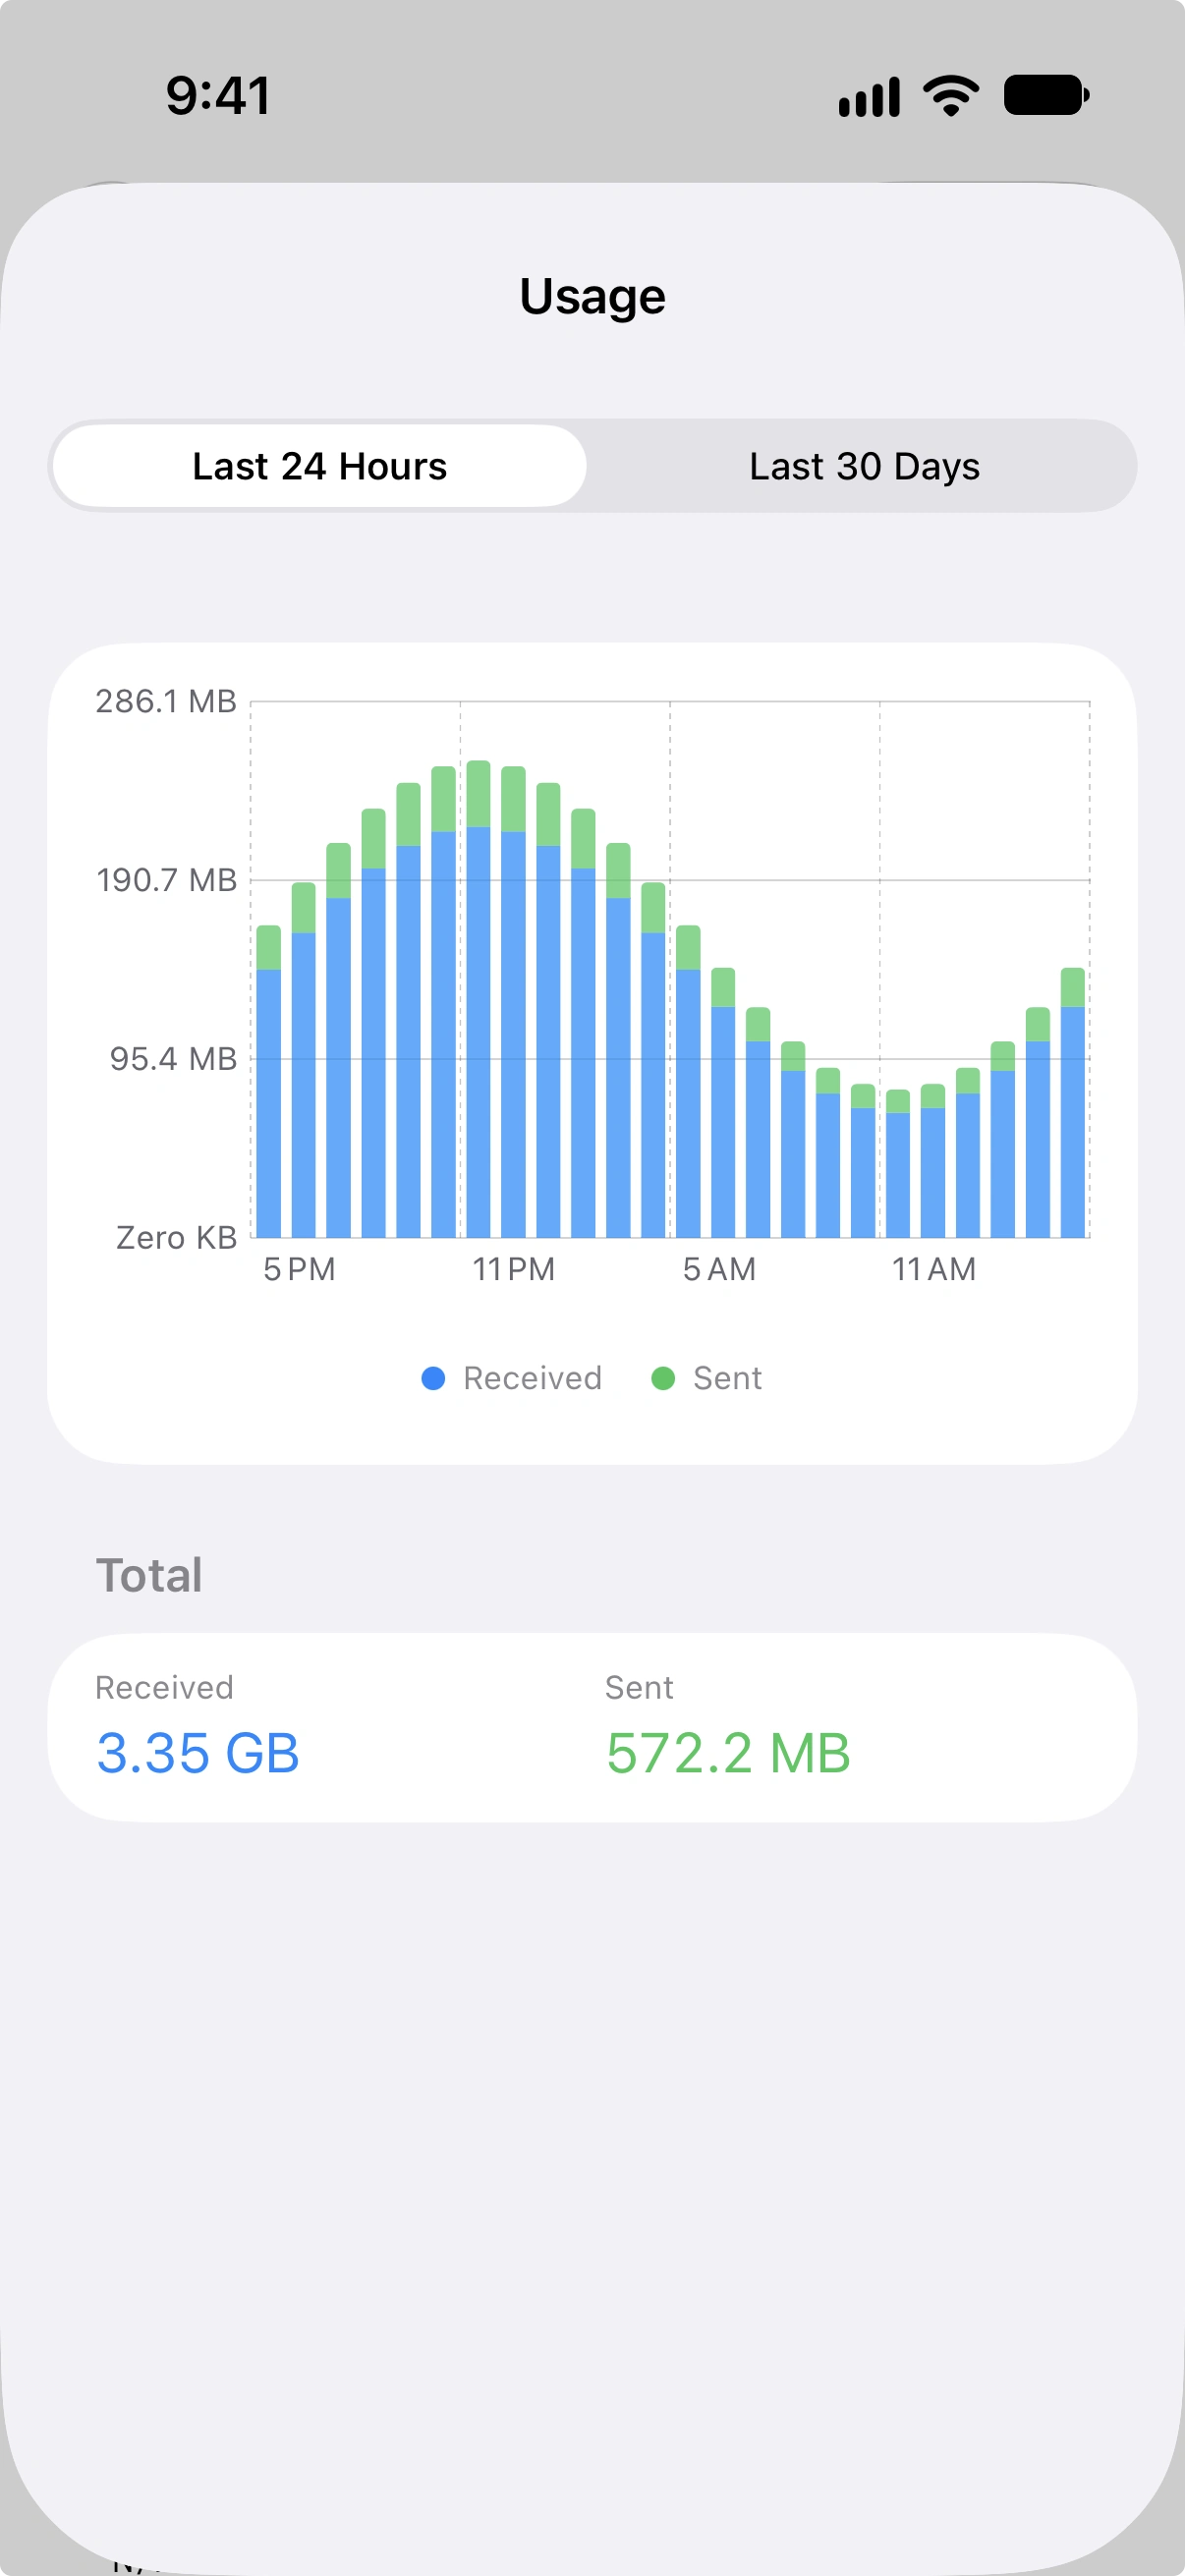
| Last 24 Hours | Hourly | One data point per hour for the past day. |
| Last 30 Days | Daily | One data point per day for the past month. |
Chart Visualization
Bandwidth data is displayed as a bar chart on iOS 16.0 or later, macOS 13.0 or later, and visionOS 1.0 or later. On iOS 15 and macOS 12, the chart area shows an unavailable message while cumulative totals remain available.
Live handshake and Rx/Tx counters continue to appear in tunnel status.
Below the chart, cumulative Rx and Tx totals are shown for the selected time range. The chart refreshes automatically every 60 seconds.
How Bandwidth Data Works
Bandwidth statistics are built from snapshots, where each snapshot records a timestamp along with cumulative receive and transmit byte counts. The intervals shown in the chart are calculated as deltas between consecutive snapshots, giving you the amount of data transferred during each time period.
Version Information
The Settings screen displays version details at the bottom:
- App version and build number — Shown in the format
X.Y.Z (build), whereX.Y.Zis the marketing version andbuildis the internal build number. - WireGuard Go version — The version of the WireGuard Go backend used by the network extension.